In the State of Colorado any underground fuel lines have to be tested for leaks. Usually that means that the outside of a double-wall line is tested with an industrial gas meter. (The inner part of the double-wall line contains the fuel while the space surrounding that should only contain air.)
This is a Python script to plot UG gas readings like those taken to test an underground fuel line. Note: This data is not real but the method is very similar to what I actually do when inspecting double-wall fuel lines. There are a few reasons I decided to add post this code in particular. First, I do a lot of environmental compliance work including testing fuel lines. Second, I'm working on posting a lot more Python code because I do so much work in Python. One of the typical things a programmer needs to do is access data from Excel. There are two main ways that I've done so in Python:
- Use the package 'XLRD'
- Use the package 'pandas'
I've written some notes about the code as posted. This may be helpful to people who are trying to read data from Excel into Python. I've done a very very large amount of this. If you have a question send me an email - I'll try to get back to you.
Note: The data being analyzed was created in Python for this purpose and is NOT real data.
I'll be using pyplot to plot the data. I've imported pandas as pd to keep it short. Note: In the downloadable Python code the Excel file name has to be updated. (Sorry!) I also changed any NA values to -1. Since NA is non-numeric it won't plot well. But we can plot -1. Of course ppm (parts per million) or %LEL (percent Lower Explosive Limit) are non-negative. It should be pretty clear that this particular data is missing and isn't actually -1.
# eric@focusNumeric.net
# Underground Fuel Line Gas Inspections

import pandas as pd
import matplotlib
import matplotlib.pyplot as plt

inputFilename = "UG_Inspection_Data.xlsx"
UGData = pd.read_excel(inputFilename, header=1)
# Define data sets. Non numeric stuff is replaced with '-1'
The next part of the code defines the location of the data and creates some variable names. Some programmers may not like how explicit I am about variables but I've found that I really appreciate these kinds of names if I have to edit code I wrote years or months eariler. : )
The variable UGData is all of the data contained in the Excel sheet we are reading. We need to pull data out of it. Again, I'll name all of this explicitly so that I know exactly how to find it. pandas uses the method "iloc" for indexing. It is a good thing to be able to index data exactly. The method is similar to how things are accessed in MATLAB. "iloc[a:b, c:d]" takes rows a through b and columns c through d. The "transpose" method flips column vectors into row vectors, of course. Here we also killed any "NA" values using the method "fillna." I also turned the data into lists for plotting.
The other data subsets are done similarly. I won't comment on them each separately.
# B1W AST to EPS Set 1
B1W_Name = 'B1W AST to EPS Set 1'
B1W_LEL = UGData.iloc[2,5:30].transpose()
B1W_LEL = B1W_LEL.fillna(value='-1')
B1W_LEL = list(B1W_LEL)
B1W_VOC = UGData.iloc[3,5:30].transpose()
B1W_VOC = B1W_VOC.fillna(value='-1')
B1W_VOC = list(B1W_VOC)
B1W_O2 = UGData.iloc[4,5:30].transpose()
B1W_O2 = B1W_O2.fillna(value='-1')
B1W_O2 = list(B1W_O2)
B1W_CO = UGData.iloc[5,5:30].transpose()
B1W_CO = B1W_CO.fillna(value='-1')
B1W_CO = list(B1W_CO)
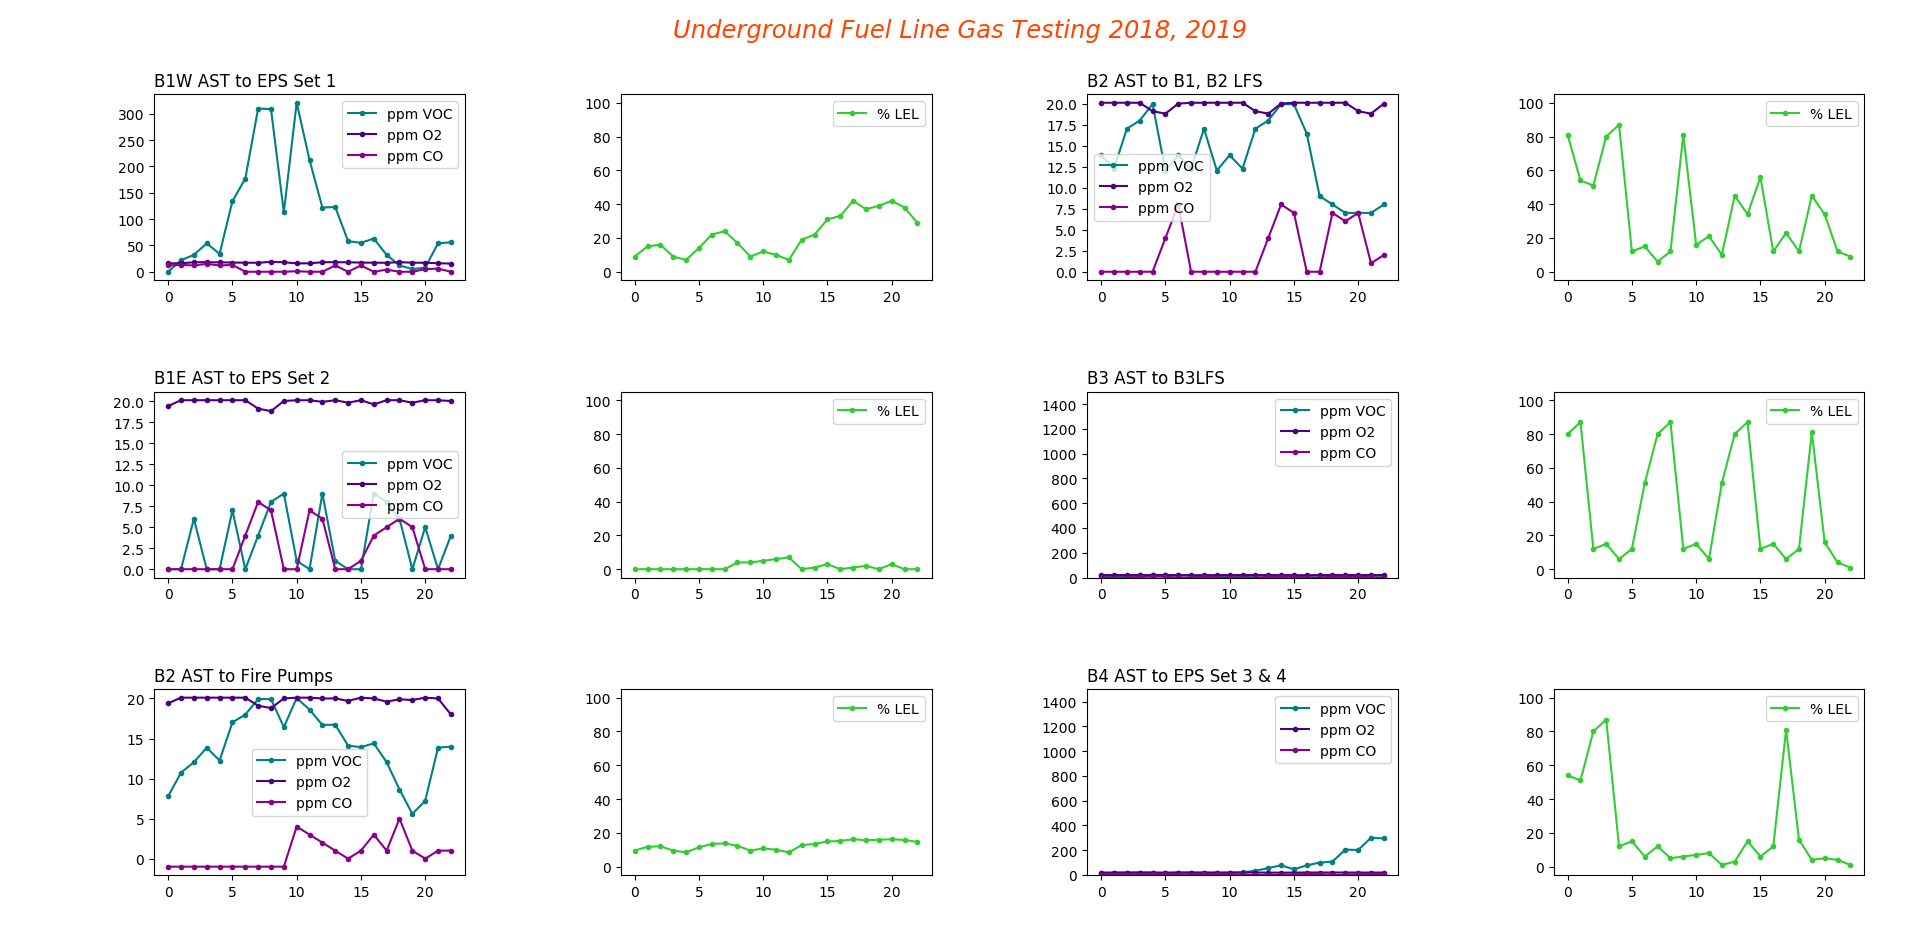
The remainder of the code is for plotting. We used the package "pyplot" for this. The "plt.subplots(3,4)" method is creating a 3-row, 4-column space for plots. At this point it just takes some time to tweek the plotting parameters to get it to look right. I plotted the values in ppm together and the %LEL values separate. That %LEL value is important when looking for volatile organic materials like fuel. Of course we don't want to mix ppm and % together on one plot. The %LEL value is also more important chemically than the other values. The gas meter is looking for CO or H2S but is probably finding a related compound. The O2 level reveals something about whether the line is rusting. Namely, if water is causing rust excess O2 is being consumed in that chemical reaction. The LEL value, however, is a good indicator that there is actually (flammable) fuel in the secondary line.
# Plot 3 (3 x 2) plots
fig, axx = plt.subplots(3,4)
# B1W
#axx[0].set_ylim((-1,1500))
axx[0,0].plot(B1W_VOC, color="teal", marker='.')
axx[0,0].plot(B1W_O2, color="indigo", marker='.')
axx[0,0].plot(B1W_CO, color='darkmagenta', marker='.')
axx[0,0].set_title(B1W_Name, loc='left')
axx[0,0].legend(labels=["ppm VOC", "ppm O2", "ppm CO"])
axx[0,1].plot(B1W_LEL, color='limegreen', marker='.')
axx[0,1].set_ylim((-5,105))
axx[0,1].legend(labels=["% LEL"])
The last section of code ties all of the subplots together. Here we added a title to the plot and chose a tightened layout. The last command "plt.show()" is necessary.
fig.suptitle("Underground Fuel Line Gas Testing 2018, 2019", fontsize=17.5, fontstyle='oblique', color='orangered')
plt.tight_layout()
plt.subplots_adjust(wspace=.5, hspace=.6, top=.9)
font = {'family' : 'normal',
        'weight' : 'bold',
        'size'   : 6}
matplotlib.rc('font', **font)
plt.show()
I'm going to post more Python code in the near future. Keep in touch!
Links to datasets and Python Code.
UG_Gas_Inspections.py Python file
UG_Inspection_Data.xlsx Excel File
Python Output PNG (image)
Depending on your browser you may have to 'save as.'
Some places to find out more:
- Python Data Analysis Library website: pandas.
- The Python package index for pandas: pandas.
- PANDAS "read_excel" documentation: pandas.read_excel method documentation.
- The Python package index for XLRD: XLRD.