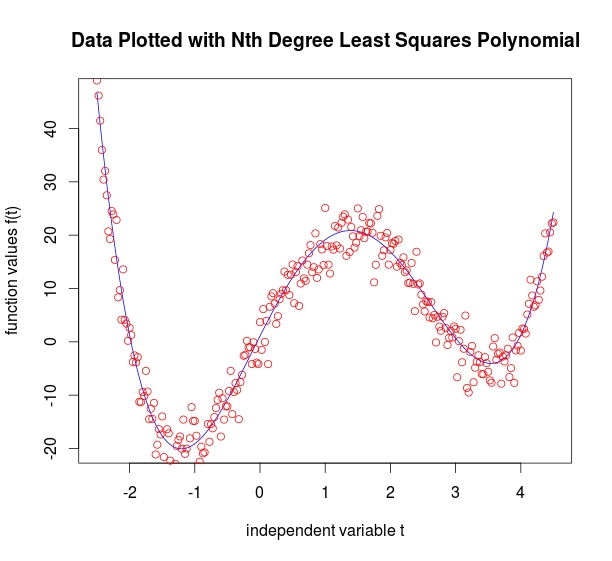
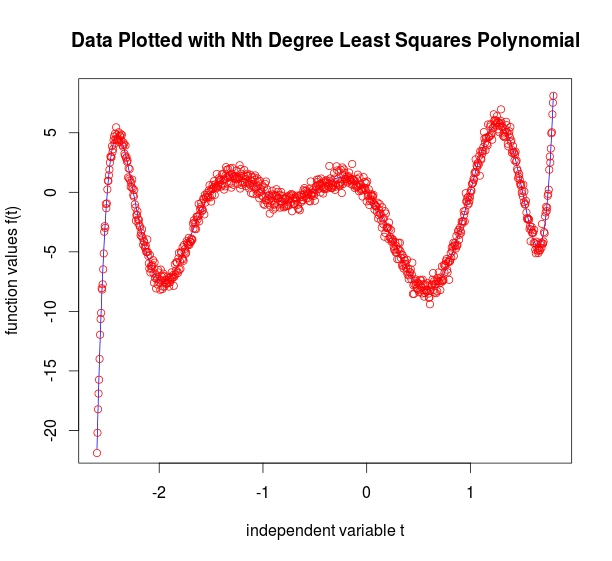
I wanted to write some R code that would produce least-squares polynomials of any order for arbitrary data. I had previously created some Matlab code to do this. An explanation of the technique, including the theory, can be found here: Polynomial Best Fit with Matlab
Although the mathematical logic under the hood is the same for both R and Matlab, there are some differences in implementation. Some of the differences exist because Matlab will automatically do some things that R will not. For instance, if you try 'solve(A,b)' in R but \( A \) is not square, you will get an error. Matlab, on the other hand, will automatically try to solve the system anyway. Matlab is very tolerant of underdetermined or overdetermined systems. R... Not so much.
There are also differences in how \( QR \) decomposition is handled in R and Matlab. The Matlab command '[Q,R] = qr(A)' will perfom the \( QR \) decomposition and make both \( Q \) and \( R \) available. R, on the other hand, requires a little bit of extra code. And you have to tell it not to truncate the results:
QRdecomp <- qr(A)
Q <- qr.Q(QRdecomp, complete=TRUE)
R <- qr.R(QRdecomp, complete=TRUE)
The documentation for \( QR \) decomposition can be found here: QR Decomposition in R. More details about getting \( Q \) and \( R \) from a \( QR \) decomposition can be found here: QR Auxiliaries
Here's the full code to produce a least-squares polynomial fit with arbitrary order:
LeastSquaresDegreeN <- function(t, b, deg)
{
# Usage:  t is independent variable vector, b is function data
# i.e., b = f(t)
# deg is desired polynomial order
# deg <- deg + 1 is a little adjustment to make the R loops index correctly.
# This is kind of an annoyance because the code will throw an error if you just keep deg as is and then change the loop to end at deg
# instead of deg-1.  I spent hours trying to chase this 'off by one' error to no avail.  However, this code does work!

deg <- deg + 1
t <- t(t)
dataSize <- length(b)
A <- mat.or.vec(dataSize, deg)  # Built-in R function to create zero matrix or zero vector of arbitrary size

# Given basis phi(z) = 1 + z + z^2 + z^3
# Define matrix A

for (i in 0:deg-1) {
    A[1:dataSize,i+1] = t^i
}

# Compute QR decomposition of A.  Pull Q and R out of QRdecomp
QRdecomp <- qr(A)
Q <- qr.Q(QRdecomp, complete=TRUE)
R <- qr.R(QRdecomp, complete=TRUE)

# Perform Q^* b^T  (Conjugate transpose of Q)
c <- Conj(t(Q))%*%t(b)

# Find x.  R isn't square - so we have to use qr.solve
x <- qr.solve(R, c)

# Create xPlot (which is general enough to plot any degree polynomial output)

xPlot = x[1,1]

for (i in 1:deg-1){
    xPlot = xPlot + x[i+1,1]*t^i
}

# Now plot it.  Least squares "l" plot first, then the points in red.

plot(t, xPlot, type='l', xlab="independent variable t", ylab="function values f(t)", main="Data Plotted with Nth Degree Least Squares Polynomial", col="blue")
points(t, b, col="red")

# Code by Eric Johnson -- Focus | Numeric

} # End

Update
I was working on a new page for this site and decided to run my "LeastSquaresDegreeN.R" code against some data. I was having a variety of problems with it including errors that read
Error in Conj(t(Q)) %*% t(b) : non-conformable argumentsError in qr.solve(R, c) : singular matrix 'a' in solve plotVec <- seq(1,100,0.5)
yVec <- plotVec^5
which should produce a simple fifth-degree polynomial in the form \( f(x) = x^5 \) up to numerical error. However, I couldn't get it to work. The issue is that I wrote the code to accept data in the form I had it. But if you put in data in a different format (in other words, column vectors rather than row vectors), it may fail. Try this:
LeastSquaresDegreeN(plotVec,t(yVec),5)- The matrix will be singular if you tell it to find a high-order polynomial like 'LeastSquaresDegreeN(plotVec,t(yVec),31)'
- The non-conformal error is still a mystery. I have asked a question on StackOverflow here: My question
- As soon as I know how to make the code more robust I'll update it.
Links to R code:
R Code for finding second degree polynomial
R Code for finding third degree polynomial
R Code for finding any arbitrary degree polynomial
Depending on your browser you may have to 'save as.'
Second degree polynomial data with added noise Try t = -5:0.05:5
Third degree polynomial data with added noise Try t = 1:0.025:9 {This looks quadratic - but is actually third degree!}
Forth degree polynomial data with added noise Try t = -2.5:0.025:4.5
Ninth degree polynomial data with added noise Try t = -2.6:0.005:1.8
Depending on your browser you may have to 'save as.'
Some places to find out more:
- Fundamentals of Matrix Computations by David Watkins. This is a beautifully written book by one of my favorite professors from WSU. I highly recommend it!
- An excellent document comparing Matlab and R functionality by David Hiebeler at the University of Maine.
- Least Squares Polynomial Fitting from Mathworld.